LIVE · EVENTS CORRELATEDLIVE 8,247,193,640

Stop connecting the dots.
We absorbed them.

The AI-native observability platform eliminating silos across every layer of your environment.

Get a demo
Annual Report

The State of Observability 2026

Research · 24 min read
Product Launch

Ceburu AI 2.0 — Root-cause analysis in seconds

New · AIOps
The Incident View

See what an incident looks like inside Ceburu.

Metrics, logs, traces, deploys, and AI root-cause analysis — correlated automatically into a single timeline. No dashboard hopping required.

app.ceburu.io/incidents/INC-3492
Overview Incidents Detectors Topology
INC-3492 · checkout p99 spike LIVE · 04:21
p99 latency
2,318ms
↑ 412% vs baseline
Error rate
14.2%
↑ 8.1pp
Saturation
92%
↑ 38pp
Affected users
3,482
↓ stabilizing
Incident timeline · 4 services involved AI annotated
14:02:11
Detector fired: checkout p99 > 800ms
prod-us-east · severity = critical · pod checkout-7df
14:02:18
Ceburu AI correlated 3 events into one root cause
linked: deploy api@4.18.2 · trace 0x7af2… · 412 log spikes
14:03:04
Saturation alarm: connection pool 92% on prod-db-07
cluster = prod-us-east · max_conns = 200
14:04:22
PagerDuty notified · #sre-oncall paged
on-call = priya.a · response SLA = 5m
Partner Network

Connects to the stack you already run.

Browse all 130+ integrations
Cloud & Infrastructure
38 integrations
AWS
Azure
Kubernetes
Docker
Observability & Dev
42 integrations
Prometheus
Grafana
GitHub
Jira
Comms · Security · ITSM
50+ integrations
Slack
PagerDuty
Okta
ServiceNow

Everything your IT team needs.
Nothing it doesn't.

From AI-powered anomaly detection to bank-grade secure data transfers — built for enterprise scale.

From reactive firefighting
to proactive intelligence

AI algorithms analyze your entire stack in real time — surfacing actionable insights, not noise.

Predictive anomaly detection before incidents occur
ML-driven alert correlation — eliminate alert fatigue
Automated remediation workflows at enterprise scale
Self-optimizing systems that learn and continuously adapt
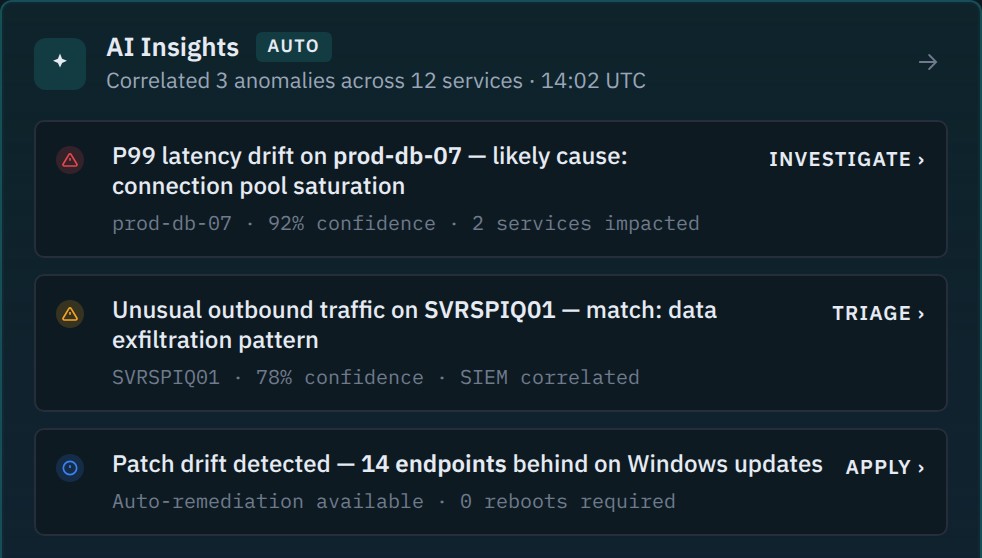
[AI] Anomaly node-07 — auto-resolved
[SIEM] Threat 198.51.x.x — investigating
[PATCH] 47 endpoints — complete
[NET] Edge latency — auto-rerouted
[BACKUP] 14.2TB verified —
0
Critical alerts
99.97%
Uptime (30d)
1.4ms
Avg response

Built for the 3am page,
not the quarterly review.

Every primitive — detectors, correlation, AI summaries, runbooks — designed for the moment your phone buzzes and the dashboard's already a mess.

Adaptive detectors
Anomaly detection that learns your baselines per-service, per-region, per-deploy. No more p99 > 800ms hardcoded thresholds that fire every Tuesday at noon.
checkout-svc · p99last 6h
baseline · 612msspike · 2,318ms (3.8σ)
Live SLO board
Track every error budget, every region, in one view. Burn-rate alerts that pre-empt the 3am page.
api availability99.96%
checkout latency98.2%
db connection pool94.1%
queue lag99.99%
Ceburu AI · root cause
Correlate metrics, logs, traces, and deploys to one prose explanation. Cite every event. Suggest a fix.
"Connection pool exhaustion on prod-db-07 introduced by api@4.18.2, 11min before first breach."
87% confidence · 3 evidences
Distributed tracing
OpenTelemetry-native. Drop into a span, see the request, the deploy, the user. Mean session replay built in.
api-gateway · 2,318ms
checkout-svc · 1,940ms
db.query · 1,210ms
pool.acquire · 920ms
Auto-remediation
Define guarded actions — rollback, scale, drain. Ceburu proposes; on-call approves; production heals.
Roll back api@4.18.2 → 4.18.1 approved
Scale db pool → 400 queued
Page #sre-oncall done · 14:04
From signal to ship

Three steps. Zero glue code.

01 / Connect

Point us at your stack.

One agent. One Helm chart. One OTel collector. Whatever you already run, Ceburu ingests — without re-instrumenting.

# Helm install helm install ceburu \ oci://reg.ceburu.io/agent \ --set token=$CEBURU_TOKEN
02 / Define

Detectors as code.

TypeScript SDK. PR-reviewable. Your detectors live in the repo with the service they protect — not in someone's saved view.

const d = ceburu.detector({ query: "db.latency.p99{prod}", baseline: "7d.median", threshold: "2σ", });
03 / Resolve

Let the AI close the loop.

Detect. Correlate. Recommend. Approve. Remediate. The page gets shorter — and so does the runbook.

// On fire await ceburu.ai.correlate(e); await ceburu.remediate("rb-022"); // MTTR: 6m → resolved.
SCALE · PRODUCTION TRAFFIC
0+
ENDPOINTS MONITORED IN PRODUCTION

Across healthcare, financial services, transportation, sports & entertainment, and managed service providers.

Platform at scale

Built for the teams that
keep the world running

0
Endpoints monitored
in production
0
Platform uptime
(rolling 12 months)
0M/s
Events ingested
at p99 87ms
8 → 1
Typical vendor
consolidation ratio
SECURITY · COMPLIANCE · CONTROLS

Built to be procured by enterprise.

Cloud and on-premises deployment 130+ pre-built integrations Single-tenant available

Ship faster.
Sleep through the night.

Join the enterprises running APM, NPM, AIOps, Infrastructure, and Security in one single platform.